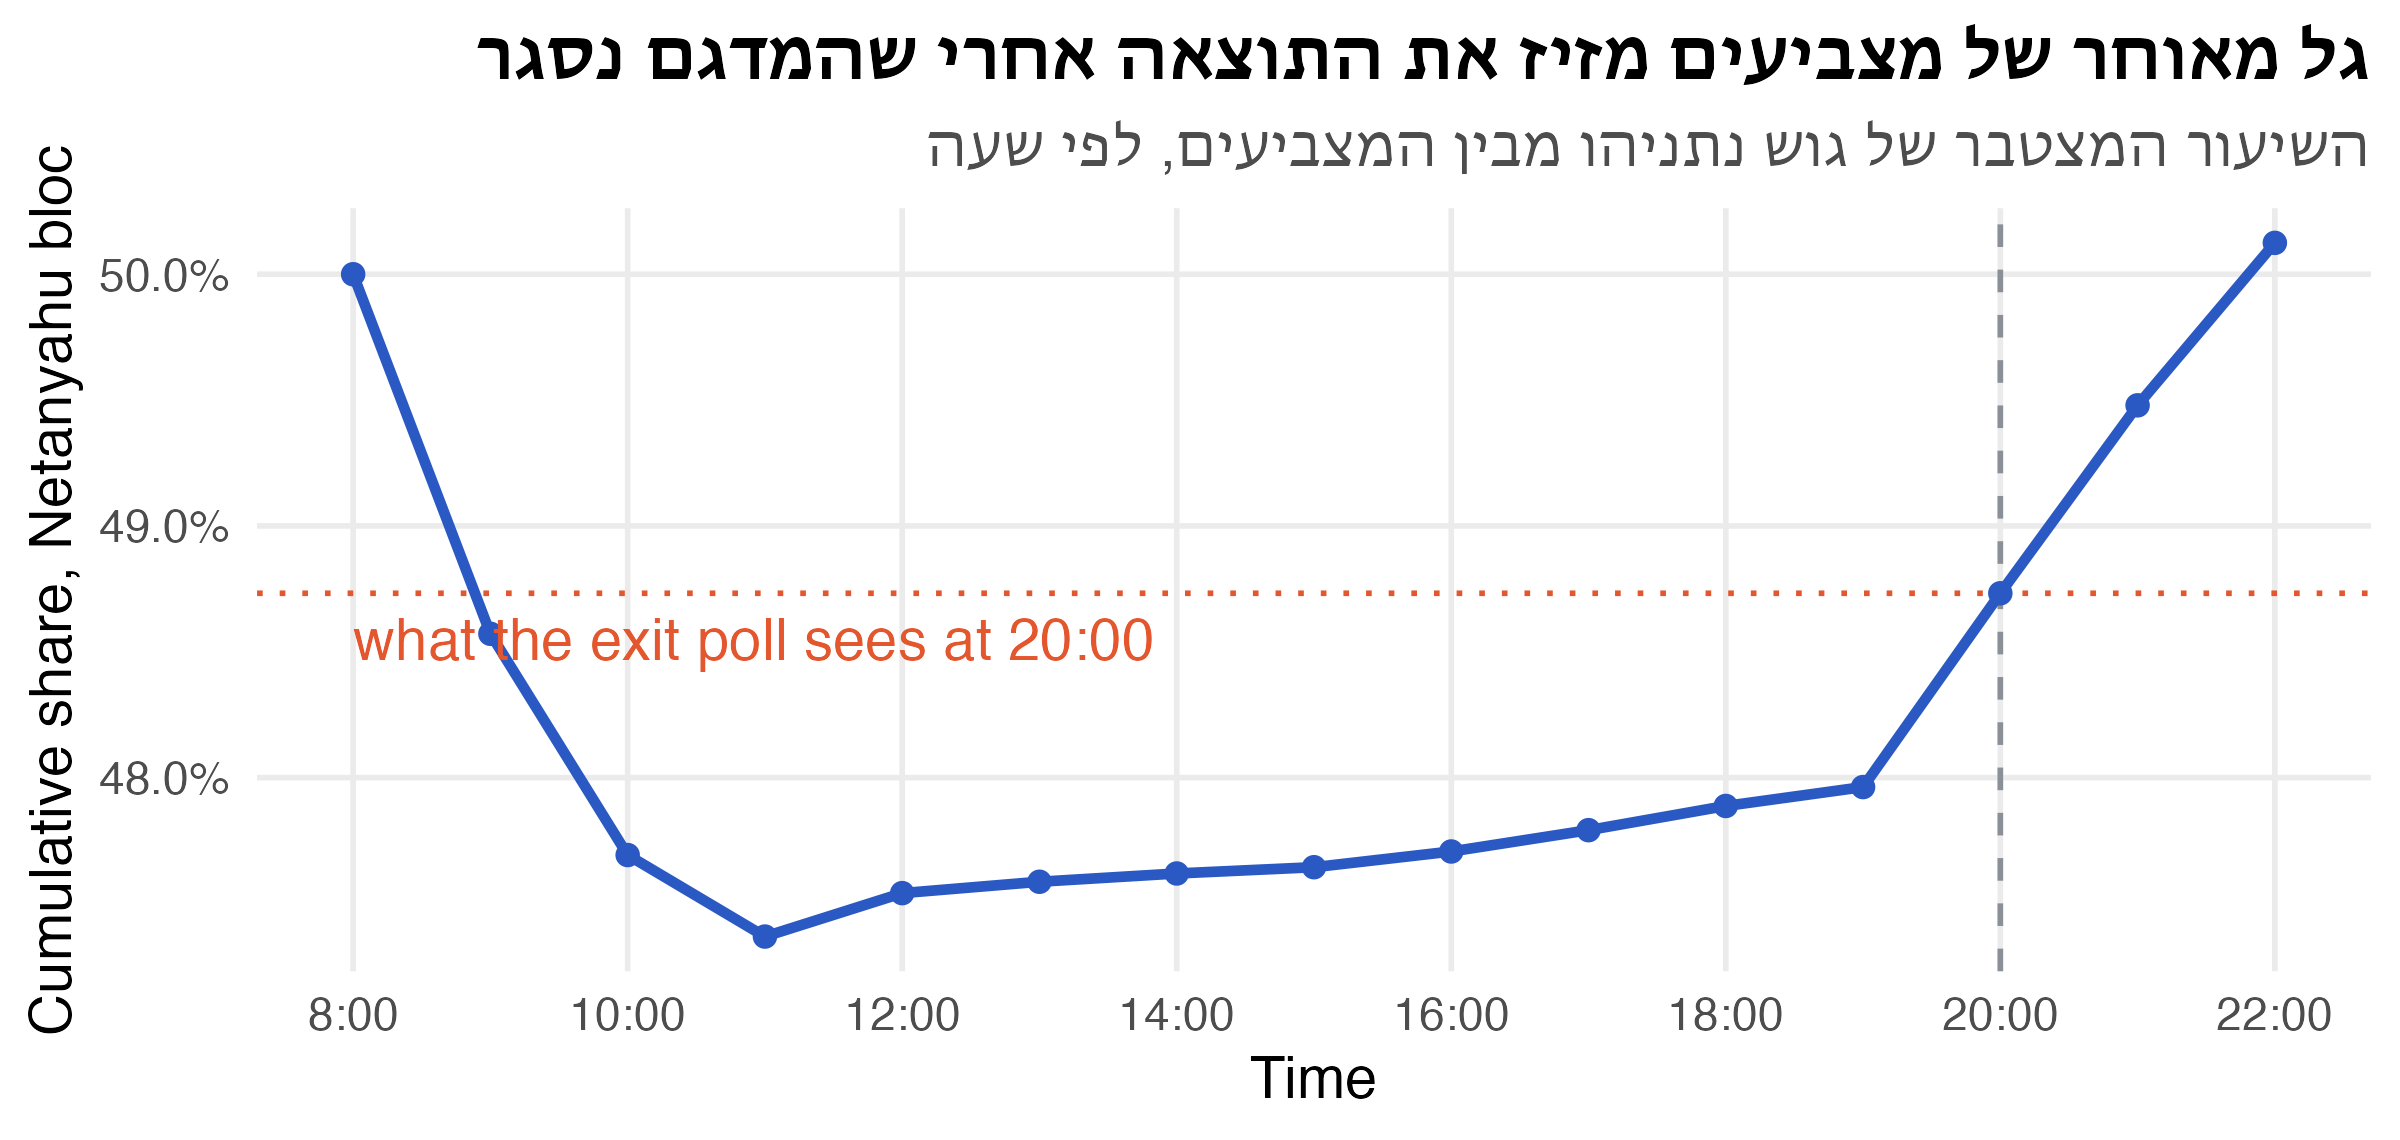
votes <- tibble(hour   = 7:21,                                # hour the vote was cast
                other  = c(3, 6, 8, 8, 7, 6, 6, 6, 7, 8, 9, 9, 8, 6, 3),
                n_bloc = c(3, 5.5, 7, 7, 6.5, 5.5, 5.5, 5.5, 6.5, 7.5, 8.5, 8.5, 7.5, 6, 3)) |>
  mutate(n_bloc = n_bloc + if_else(hour >= 19, 2.5, 0),       # late "gevalt" surge
         share  = cumsum(n_bloc) / cumsum(n_bloc + other))

cutoff <- 20                                                  # last interviews
estimate <- votes$share[votes$hour == cutoff - 1]             # extrapolated to the close
final    <- last(votes$share)

ggplot(votes, aes(hour + 1, share)) +
  geom_vline(xintercept = cutoff, colour = nanas_pal[["grey"]], linetype = "dashed") +
  geom_hline(yintercept = estimate, colour = nanas_pal[["accent"]], linetype = "dotted") +
  geom_line(colour = nanas_pal[["primary"]], linewidth = 1.2) +
  geom_point(colour = nanas_pal[["primary"]]) +
  annotate("text", x = 8, y = estimate - 0.001, hjust = 0, vjust = 1, colour = nanas_pal[["accent"]],
           label = "what the exit poll sees at 20:00") +
  scale_x_continuous(breaks = seq(8, 22, 2), labels = \(h) paste0(h, ":00")) +
  scale_y_continuous(labels = label_percent(accuracy = 0.1)) +
  labs(title = "גל מאוחר של מצביעים מזיז את התוצאה אחרי שהמדגם נסגר",
       subtitle = "השיעור המצטבר של גוש נתניהו מבין המצביעים, לפי שעה",
       x = "Time", y = "Cumulative share, Netanyahu bloc")