Test your tidyness - a short quiz to check your tidyverse capabilities
Over the last month I gave a tidyverse + intro to data science corporate training in a startup in Tel-Aviv. We had two groups (beginners and intermediates), and for the last assignment of the course I was aiming for a short quiz comprised of various topics which we covered during the course, such that can also be automated easily (i.e., multiple choice questions).
I came up with the following quiz, which I thought would be nice to share here. I guess that experts should probably be able to complete this in a few minutes, intermediate/beginners would probably complete this by up to 30 minutes.
Exam instructions
The following exam contains 10 questions which spans across the different topics regaring tidyverse, and some analysis dilemmas. Each question has four options but only one correct answer. Each correct answer provides you with 10 points.
You can use any materials you want including but not limited to: cheat sheets, our course materials, stack overflow, package documentation, running code and seeing what it does.
Question 1:
When would you use an R markdown file (.Rmd) versus a script file (.R) to save your work?
- If I want the relative position of the file retained (so that it is easier to load files from the same directory), I will use an .Rmd file, otherwise I will use a .R file.
- When I want a complete documentation of my work in a report I will use a .Rmd. I will use a .R file for debugging and sourcing functions.
- There is no significant difference between the two formats, and they can be used for the same things interchangably.
- There is no benefit to using .R script files, the .Rmd format is always superior.
Question 2:
Look at the following segments of code.
# segment 1:
new_data <- read.csv("myfilename.csv")

# segment 2:
new_data %>%
   group_by(some_cool_suff) %>%
   summarize(average = mean(avg_me, na.rm = T)) -> updated_df

# segment 3:
avg_var <- mean(new_data$avg_me[!is.na(some_cool_stuff)], na.rm = T)

# segment 4:
data.frame(a = 1:10, b = letters[1:10]) %>%
   sample_n(3)
Which segments would you classify as tidyverse syntax?
(tidyverse syntax = code which uses functions from tidyverse packages, in which there is no function that you can replace to a tidyverse equivalent)
- Segment 1 and segment 3.
- Segment 2 and segment 4.
- Segment 4.
- Segment 2.
Question 3:
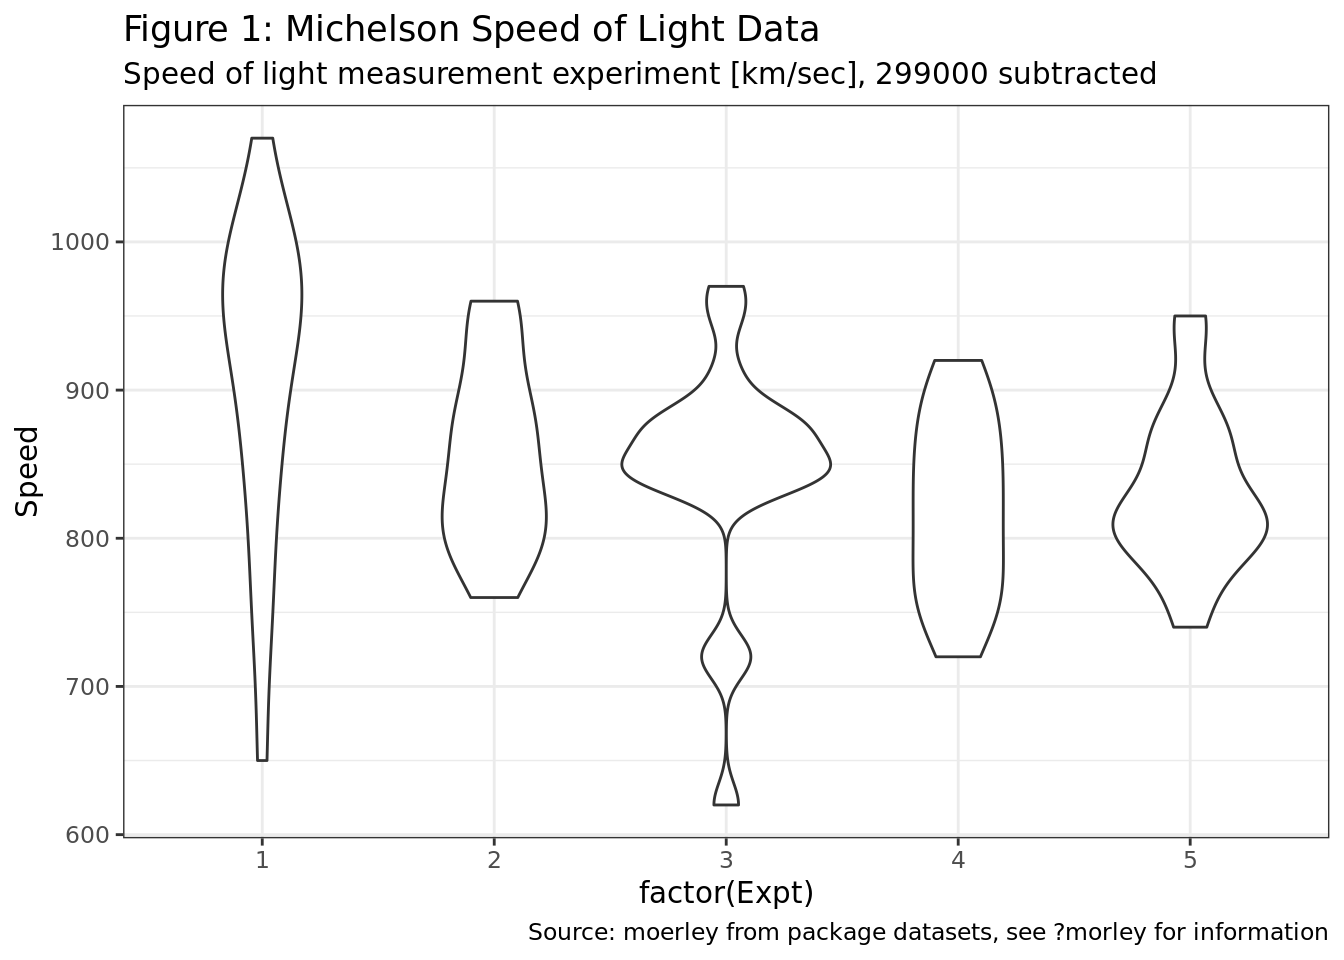
What ggplot2 geoms would you use to generate the following charts?
- Figure 1: not generated with
ggplot2, Figure 2:geom_point. - Figure 1:
geom_boxplot, Figure 2:geom_line. - Figure 1:
geom_violin, Figure 2:geom_point. - Figure 1:
geom_boxplot, Figure 2:geom_point+geom_line.
## `geom_smooth()` using formula 'y ~ x'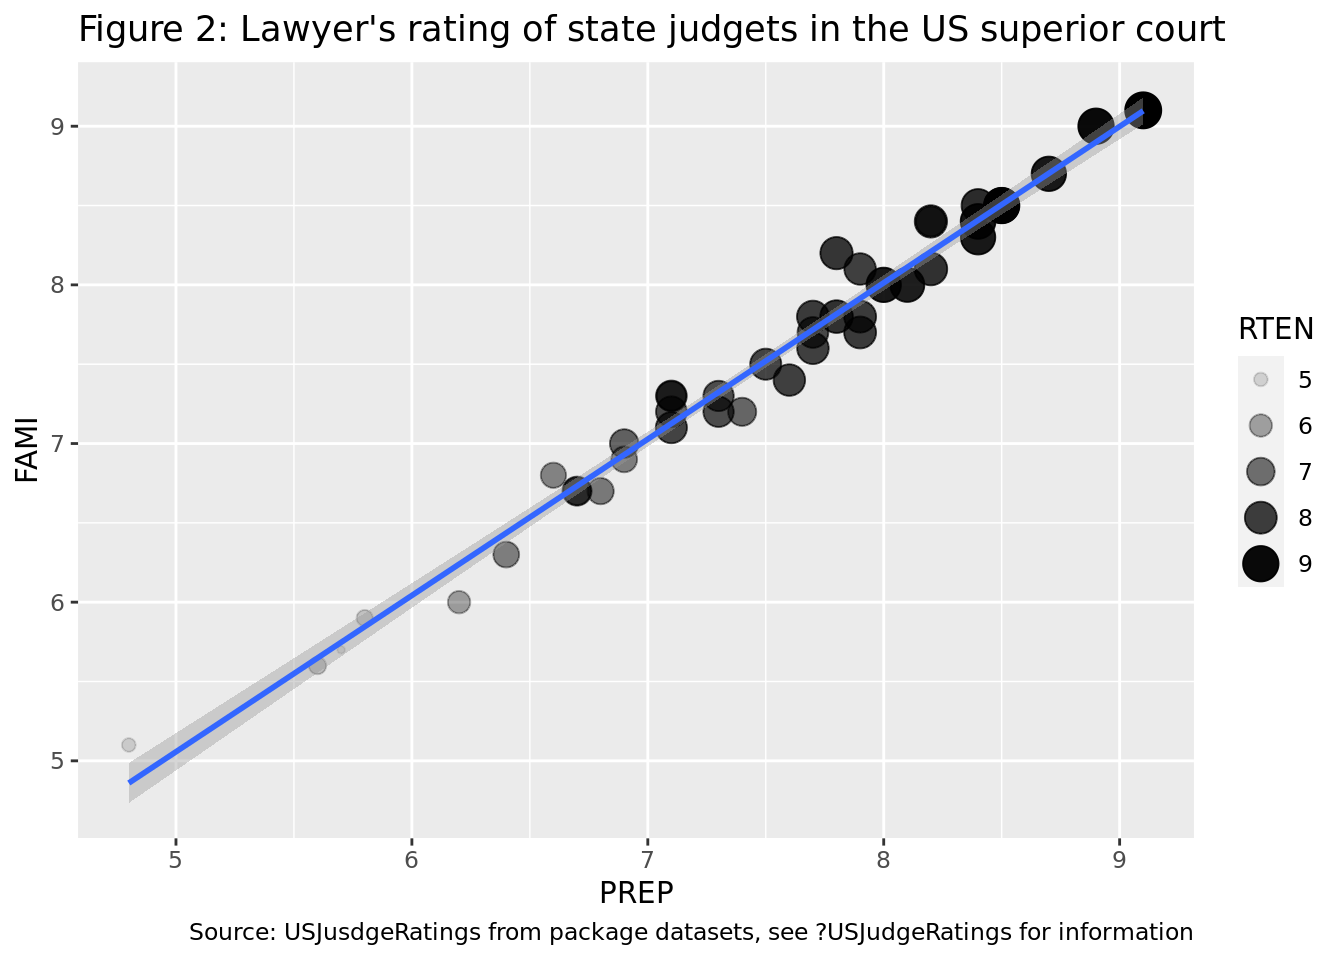
Question 4:
What is the difference between the matrix and the tibble in the following?
matrix(cbind(1:10, letters[1:10], LETTERS[1:10]), ncol = 3)## [,1] [,2] [,3]
## [1,] "1" "a" "A"
## [2,] "2" "b" "B"
## [3,] "3" "c" "C"
## [4,] "4" "d" "D"
## [5,] "5" "e" "E"
## [6,] "6" "f" "F"
## [7,] "7" "g" "G"
## [8,] "8" "h" "H"
## [9,] "9" "i" "I"
## [10,] "10" "j" "J"tibble(num = 1:10, sl = letters[1:10], cl = LETTERS[1:10])## # A tibble: 10 × 3
## num sl cl
## <int> <chr> <chr>
## 1 1 a A
## 2 2 b B
## 3 3 c C
## 4 4 d D
## 5 5 e E
## 6 6 f F
## 7 7 g G
## 8 8 h H
## 9 9 i I
## 10 10 j J- The tibble has named variables (columns) and the matrix does not name the columns.
- The tibble retains the original data type and the matrix converts the data types.
matrixis a base R function andtibbleis a tidyverse function.- All of the above.
Question 5:
What stringr function would you use to simplify the following code?
some_string <- c("How are you today?", "Is this test ok?", "You're already half way in!")
map_chr(some_string, ~paste0(stringi::stri_wrap(., width = 5), collapse = "\n"))str_count.str_wrap.str_sub.- No such function: must use a combination of a
stringrand a loop (or amapfunction).
Question 6:
What is the difference between contains and one_of?
- Both are “select helpers”,
one_ofis used to specify strings which starts with one of the specified expressions, andcontainslets you specify the variable names in “non standard evaluation” (unquoted) style. containsselects variables based on the regular expression you feed as an argument.one_ofneeds you to specify the variable names as strings.containsselects variables which contain the literal string you feed into it.one_ofneeds you to specify the variables names as strings.- Both functions do the same thing with the same arguments.
Question 7:
When reshaping data with the gather function, what is the meaning of the ... argument?
- Specify which variables to gather by.
- Specify which variables not to gather by (using the “-” sign).
- Specify either a or b.
- Provide variable by which to group the resulting tibble.
Question 8:
What function would you use to get all the rows in tibble1 which are not in tibble2?
setdiff(tibble1, tibble2)setdiff(tibble2, tibble1)intersect(tibble1, tibble2)semi_join(tibble1, tibble2)
Question 9:
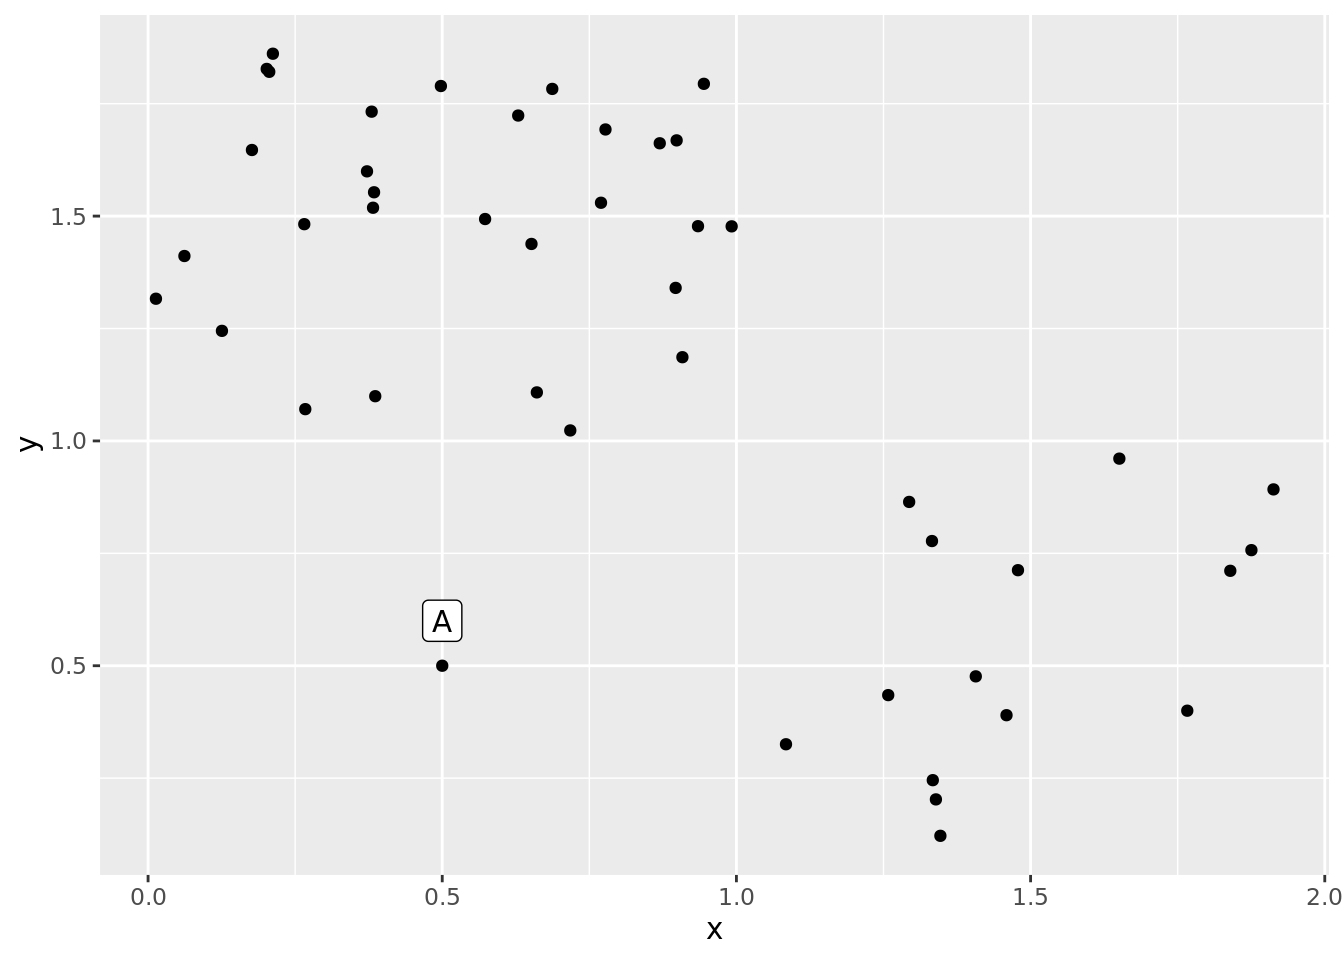
Assume you examine the data which appears in the following scatter plot using per-axis boxplots. Would classify point A as an outlier?
- Yes, only accoring to the y-axis.
- Yes, only according to the x-axis.
- Yes, according to either x-axis or y-axis.
- No, it will not be classified as an outlier.
Question 10:
You encountered a data set in which all variables are normally distributed with an unequal variance and unequal expectancy (mean). You wish to run a KMeans clustering to cluster the data. What would you do as a preprocessing step?
- Scale and center the data using the function scale.
- Scale and center the data using min-max scaling and centering.
- Either a or b.
- Nothing - since the data is already normally distributed, no scaling or centering is required.
Bonus question (5 points bonus):
Did you sign up for R-Bloggers updates? (feed to receive R related news and updates)
- Yes (5 points bonus).
- No, but I’m doing it now (2.5 points bonus).
- No, and I don’t intend to.
P.S. I’m not getting any benefits from R-bloggers for “advertising” them, I genuinly think it’s a great source to stay updated, and improve your R capabilities.
Quiz answers
Answers available in the following gist.